
The Global Trade in Services & Pakistan
PBC’s Report: “The Global Trade in Services & Pakistan” tries to answer the following questions: What are services exports, how...
PBC’s Report: “The Global Trade in Services & Pakistan” tries to answer the following questions:
A services export is any service that is provided by a resident in one country to people or companies from another country. In contrast to goods, services are intangible. This means that services, as opposed to goods, cannot be touched, felt or seen, services thus can only be experienced.
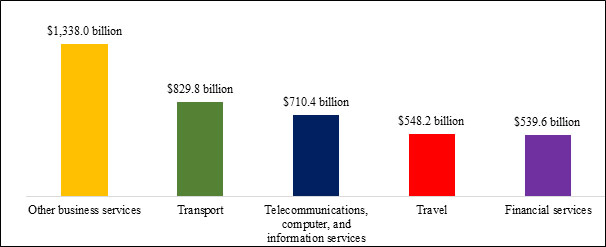
In 2020, the quantum of global services trade was about $5.0 trillion.
Services trade is classified under broad categories such as Travel, Transport, Financial, Other business services, Telecommunications, computer and information services, etc. Global trade in services is classified by the IMF under BPM6/ EBOPS 2010. The IMF’s method of classification has been used in this report.
Top 5 Global Services Exports Categories in 2020
Top 5 Services Exporting Countries in 2020
| Rank in Export of Services | Countries | 2019 | 2020 | % Change Over 2019 |
|
| $ Billion | |||||
| 1 | United States | 876.3 | 705.6 | -19.5 | |
| 2 | United Kingdom | 405.5 | 342.4 | -15.6 | |
| 3 | Germany | 346.7 | 310.7 | -10.4 | |
| 4 | China | 283.2 | 280.6 | -0.9 | |
| 5 | Ireland | 247.8 | 262.7 | 6.0 | |
Pakistan was Ranked 61st in the World in 2020 for Services Exports, with its Services Exports being about $5.4 billion, and with a CAGR of 1.5% between 2016 to 2020.
Pakistan’s Services Exports and Major Markets
| World Rank in Export of Services | Countries | 2016 | 2017 | 2018 | 2019 | 2020 | CAGR |
| $ One Hundred Million | 2016-2020 | ||||||
| % | |||||||
| 1 | United States | 7809.4 | 8337.8 | 8617.3 | 8763.0 | 7056.4 | -3.0 |
| 2 | United Kingdom | 3587.4 | 3689.4 | 4142.2 | 4054.8 | 3424.4 | -1.1 |
| 3 | Germany | 2934.5 | 3189.0 | 3497.6 | 3466.6 | 3106.6 | 1.5 |
| 4 | China | 2591.8 | 2744.3 | 3028.7 | 2941.2 | 2455.8 | 3.1 |
| 5 | Ireland | 1495.2 | 1828.2 | 2225.6 | 2478.2 | 2627.0 | 15.2 |
| 61 | Pakistan | 50.5 | 63.3 | 59.3 | 58.7 | 53.5 | 1.5 |
Pakistan has improved from being ranked 77th in 2019 to being 61st in 2020. Pakistan however, has the potential to improve its rank in the coming years.
Based on global demand and Pakistan’s own strengths, Pakistan’s focus should be on selected categories instead of trying to cater to a wide portfolio of services. In the initial phase it can look to expand exports in existing markets. Below are the markets and the selected categories on which Pakistan should focus in the near to medium terms. Pakistan’s current exports and total imports for these classifications by the identified countries is also given below:
Pakistan’s Existing Top 5 Markets in 2020 & Suggested Services Categories for Specialization
| Rank | Classification 9, Telecommunications, computer, and information services | Classification 10, Other business services | Classification 7, Financial services | Classification 6, Insurance and pension services | ||||||||
| $ Million | $ Million | $ Million | $ Million | |||||||||
| Country | Pakistan Exports (2020) | Imports from the World (2020) | Country | Pakistan Exports (2020) | Imports from the World (2020) | Country | Pakistan Exports (2019) | Imports from the World (2019) | Country | Pakistan Exports (2020) | Imports from the World (2020) | |
| 1 | U.S.A. | 847.8 | 38,594.0 | U.S.A. | 333.7 | 117,673.0 | U.S.A. | 83.2 | 42,256.0 | U.K. | 10.5 | 3,168.0 |
| 2 | U.A.E. | 124.9 | 4,302.0 | U.A.E. | 111.3 | – | China | 13.8 | 3,174.0 | Singapore | 10.8 | 5,317.0 |
| 3 | U.K. | 108.9 | 13,014.0 | U.K. | 109.6 | 90,399.0 | U.A.E. | 11.8 | – | U.A.E. | 7.1 | – |
| 4 | Singapore | 49.6 | 15,339.0 | Singapore | 89.8 | 58,927.0 | Germany | 4.6 | 18,338.0 | – | – | – |
| 5 | Canada | 39.9 | 29,711.0 | China | 81.1 | 50,487.0 | U.K. | 2.9 | 21,353.0 | – | – | – |
At the moment, Pakistan does not trade in Classification 1, Manufacturing services on physical inputs owned by others. However, Pakistan can seek to enter this services category and initially export to its current markets as a way of Product Development. Doing so, will diversify Pakistan’s services exports and could lead to an increase in its overall services exports.
The exports of Classification 1, Manufacturing services on physical inputs owned by others were about $115.2 billion in 2020. France and Ireland, are the top 2 importers of Classification 1, and had CAGRs of 5.3% and 25.0% for the period 2016 to 2020.
For Pakistan to expand its services exports, it needs to address some of the challenges identified below:
Infrastructure Related Challenges:
Trade-related Issues:
Market Related Issues
Improving Infrastructure as it Relates to the Services Sector
Trade-related Policies
Accessing International Markets
This report’s aim to provide a basic understanding of the Global Services Trade and Pakistan’s ranking. Having developed a better understanding of the services sector, the PBC in the next phase will do in-depth studies relating to competitiveness of selected sectors with the objective of recommending policy frameworks for enhancing these sectors competitiveness.
The PBC is a private sector not-for-profit advocacy platform set-up in 2005 by 14 (now 86) of Pakistan’s largest businesses. PBC’s research-based advocacy supports measures which improve Pakistani industry’s regional and global competitiveness. More information about PBC, its members, objectives and activities can be found on its website: www.pbc.org.pk
DownloadTelephone: 021-35630528-29
Fax: 021-35630530